
From viscosity measurement to rheology management
Bringing coating quality control closer to the real process
Are conventional viscosity measurements telling you how your coating color actually behaves on the coating machine?
Viscosity is one of the most commonly monitored properties in coating color quality control. However, paper and board coating processes expose coating colors to a very wide range of shear conditions. A coating color that looks stable in a conventional laboratory measurement can behave very differently during application and metering.
This creates an important opportunity for modern quality control: instead of treating viscosity as a single laboratory number, the complete rheological behavior can be connected to raw materials, process performance, runnability and product quality.
Low-shear and high-shear viscosity describe different behavior
Coating colors are complex, non-Newtonian suspensions. Their viscosity depends on shear rate, and the rheological response can change substantially as the material moves from storage and circulation conditions toward the much higher shear conditions encountered during coating application and metering.
Low-shear viscosity remains important for properties such as handling, pumping, mixing and circulation. High-shear rheology, however, provides information about how the coating structure responds closer to the conditions relevant to the coating process.
This is why two coating colors can show similar conventional viscosity values while behaving differently at higher shear rates. A complete viscosity–shear-rate curve can reveal shear thinning, changes in curve shape and, in some systems, high-shear thickening that a single low-shear value cannot describe.
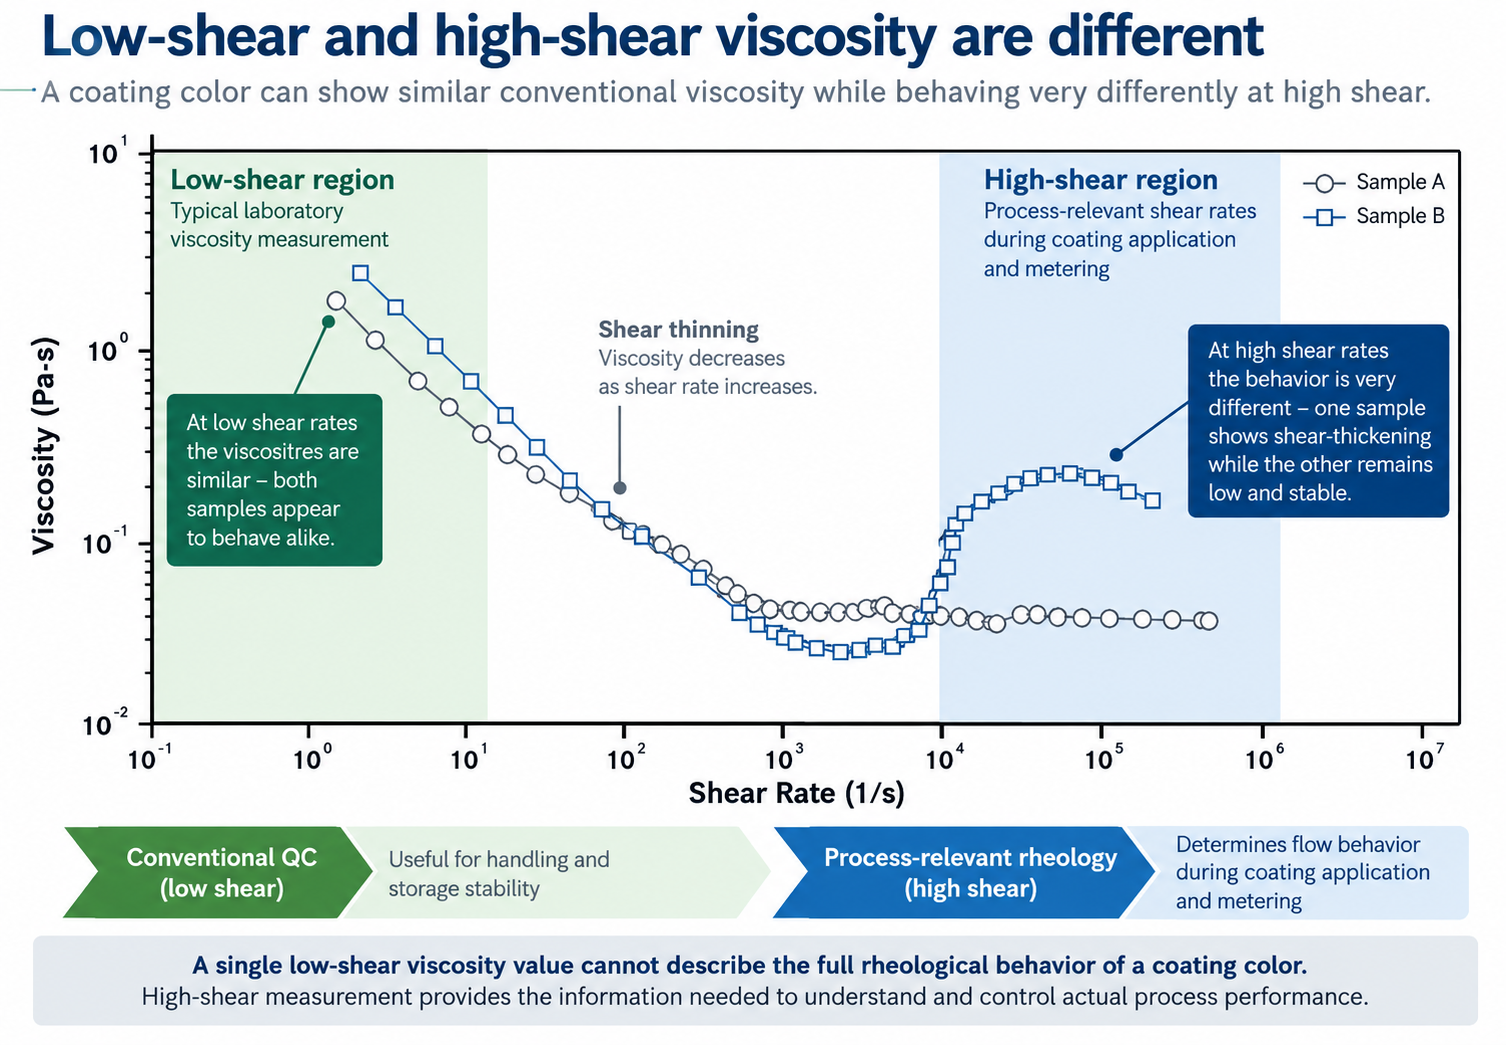
Comparison of low- and high-shear viscosity behavior in two coating color samples.
Low-shear viscosity and high-shear viscosity are complementary measurements — they describe different parts of the coating's flow behavior.
The rheology curve becomes a process fingerprint
The ACA AX-100 capillary viscometer is designed for mid- and high-shear rheology measurement. Instead of looking only at one viscosity number, the full flow curve can be used to establish a rheological fingerprint for a coating formulation.
The most useful question for a mill is therefore not only whether viscosity is inside a laboratory specification, but whether the coating's rheological behavior is inside the operating window associated with stable machine performance.
Is the rheological behavior inside the operating window that we know gives stable production?
From viscosity curves to actionable quality control
A complete rheology curve contains considerably more information than a single viscosity value. For routine quality control, however, operators need this information in a simple and repeatable form.
RheoLog software can convert each AX-100 measurement into defined rheological key parameters. Examples include viscosity at selected process-relevant shear rates, shear-thinning behavior, pressure, flow resistance and Reynolds number. This makes it possible to monitor not only whether viscosity has changed, but also how the rheological behavior has changed.
Target ranges can then be established for the most relevant parameters and trended over time. Instead of manually comparing complete viscosity curves for every production sample, the laboratory or operator can quickly identify whether a measurement remains within the established rheological fingerprint or requires further investigation.
From a single viscosity measurement → to a rheological fingerprint → to preventive quality control.
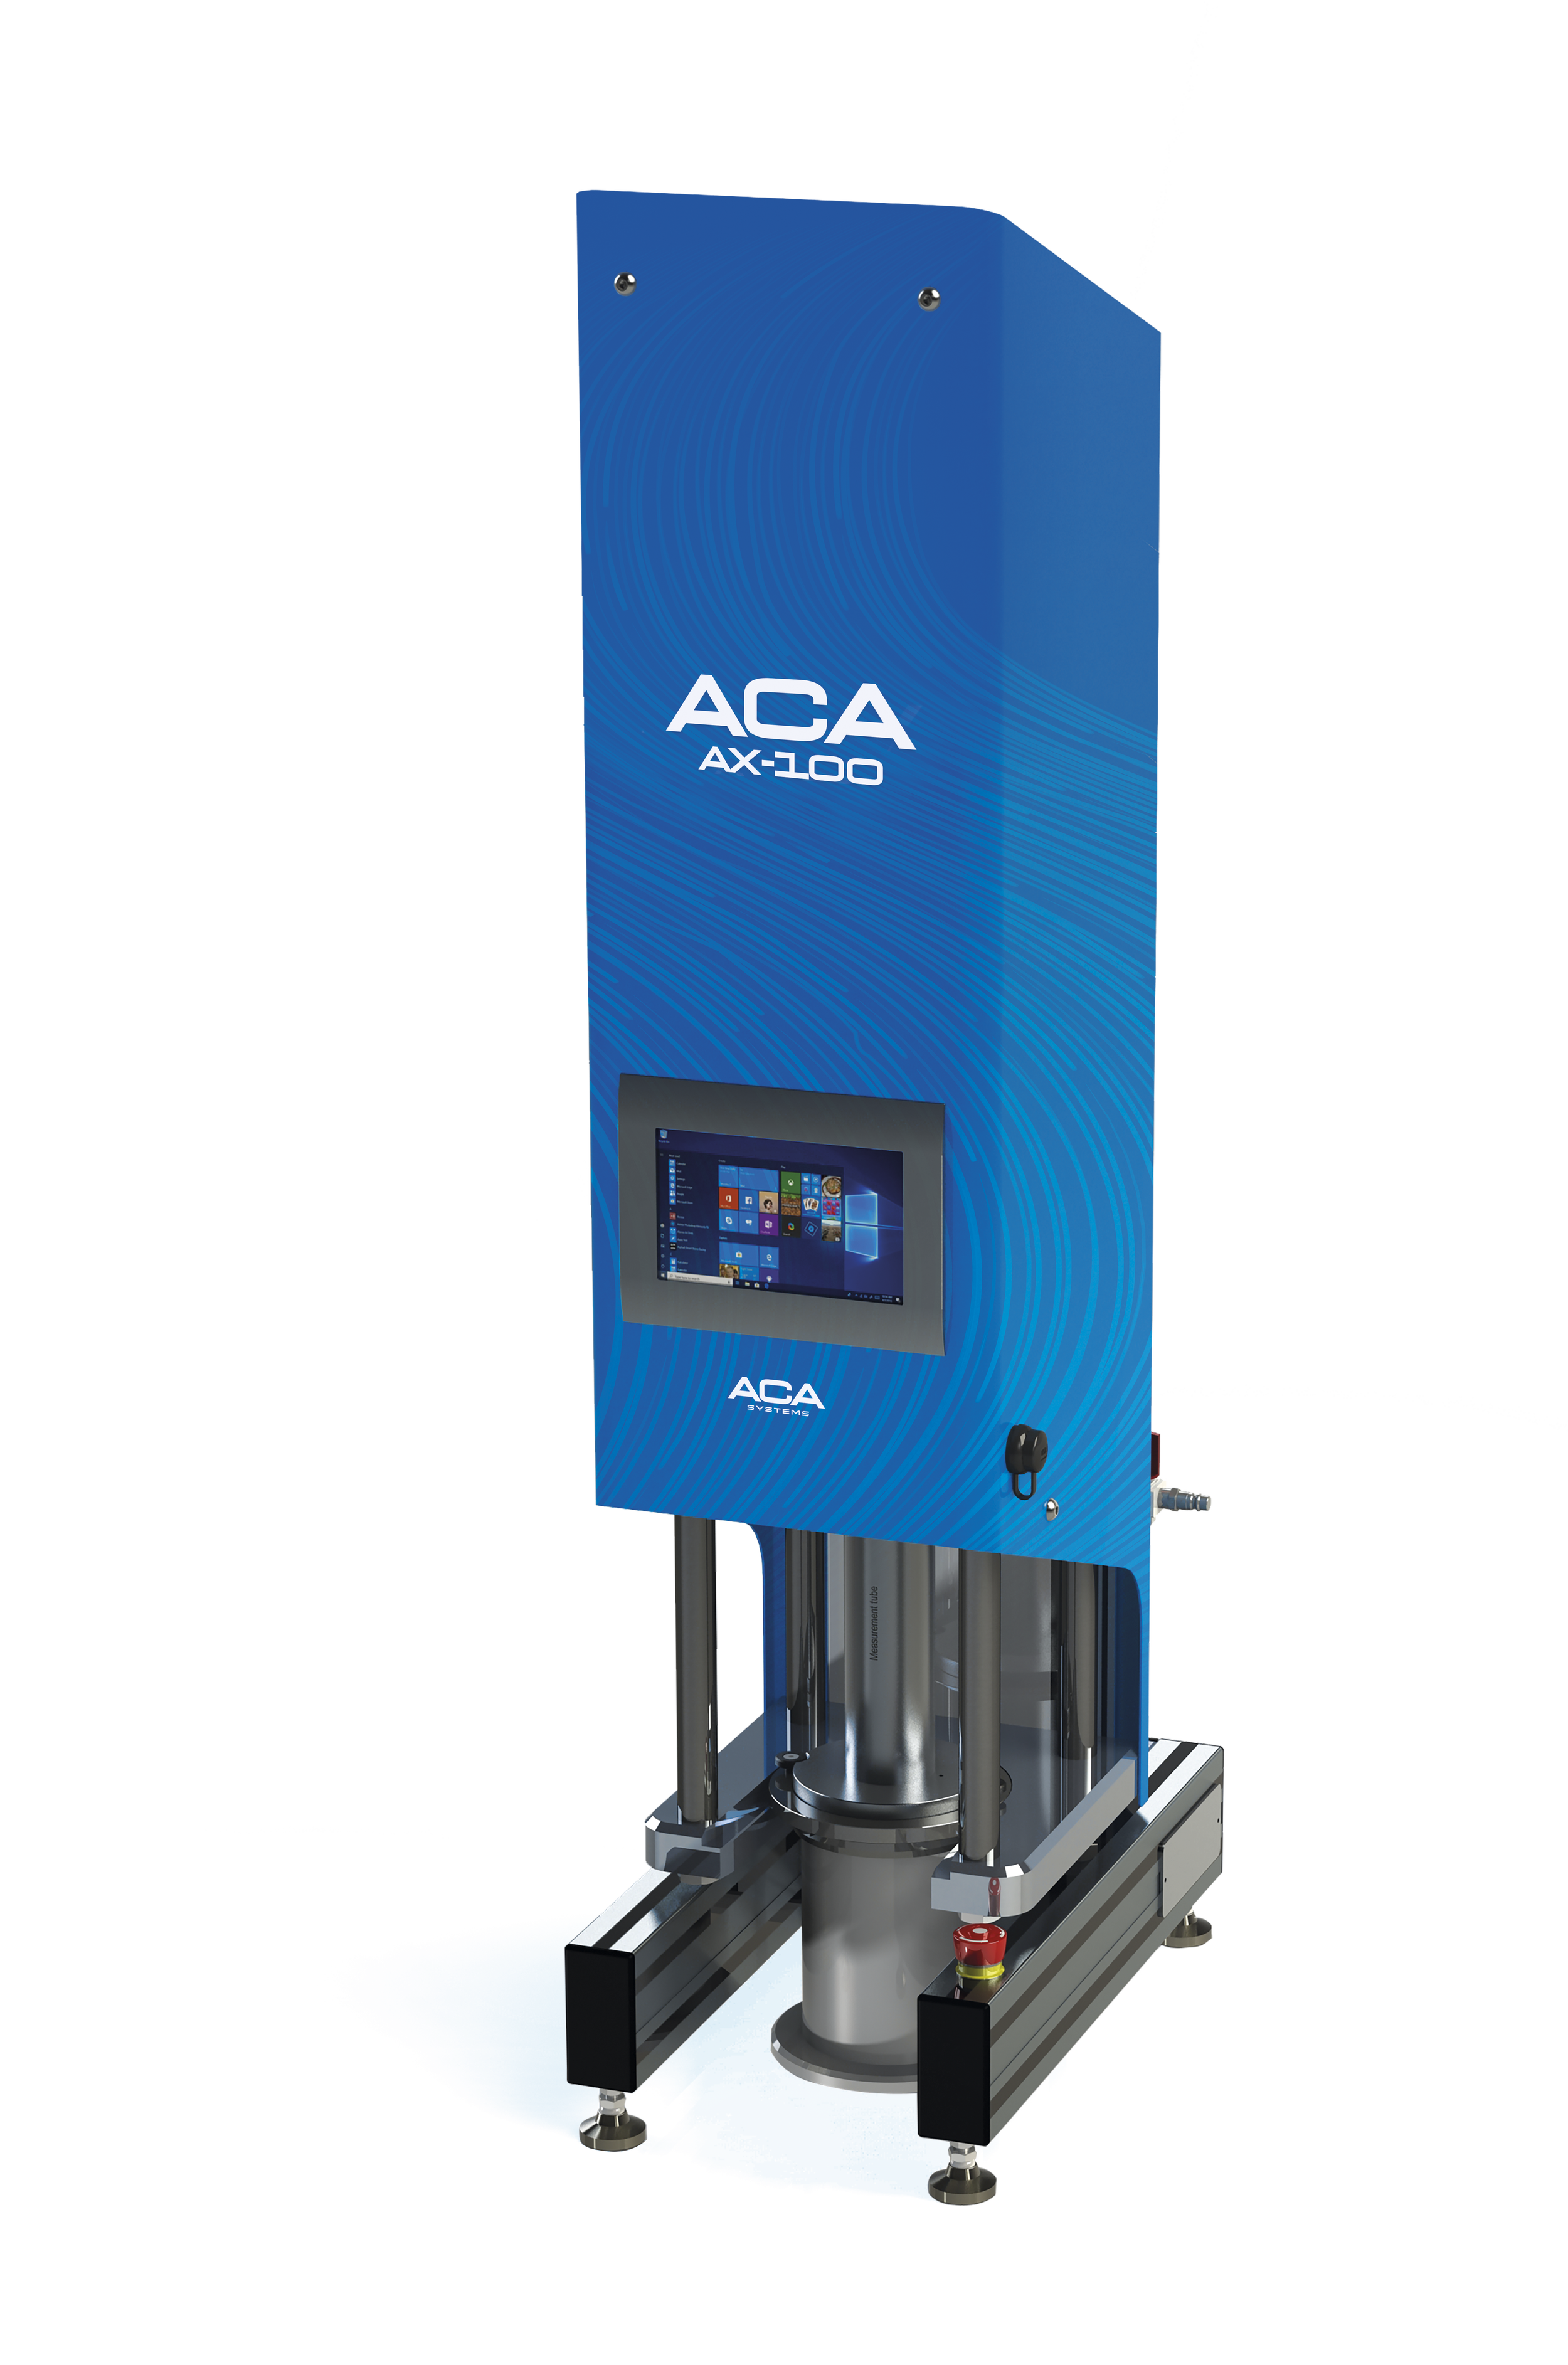
ACA AX-100 – high-shear viscosity measurement for coating color rheology
Understanding what is behind process variation
Changes in rheology can originate from several sources. Pigment particle size, particle shape and particle-size distribution, latex properties, rheology modifiers, dispersants, solids content, temperature and raw-material batch variation can all influence the measured flow behavior.
By combining rheological key values with production and raw-material information, the mill can begin to distinguish different types of variation. A change in viscosity level may have a different origin from a change in shear-thinning behavior or high-shear response.
Raw-material variation → Rheological variation → Process variation → Quality and cost
From reactive troubleshooting to preventive process control
A practical implementation does not need to begin with an arbitrary high-shear viscosity specification. The first step is to characterize representative samples from good-running production and compare them with samples collected during quality or runnability disturbances.
1. Measure — AX-100 rheology together with existing QC parameters such as solids, temperature and conventional viscosity.
2. Correlate — Connect the rheology results with raw-material batches, recipes, machine conditions, runnability and quality observations.
3. Define — Identify the rheological fingerprint and operating window associated with stable production.
4. Control — Select the most useful key values and reference shear rates for routine quality control.
5. Optimize — Use the accumulated process knowledge to evaluate formulation, raw-material and solids opportunities.
Rheology and water retention should be managed together
High-shear rheology is only one part of coating behavior. When coating color contacts the base sheet, water begins to move from the coating into the substrate. This changes local solids concentration and can therefore change rheological behavior before and during metering.
Combining AX-100 high-shear rheology with ACA Flow WR water-retention measurement provides a broader view of coating performance. The objective is to establish an operating window in which both flow behavior and water retention support stable application, metering and coating consolidation.
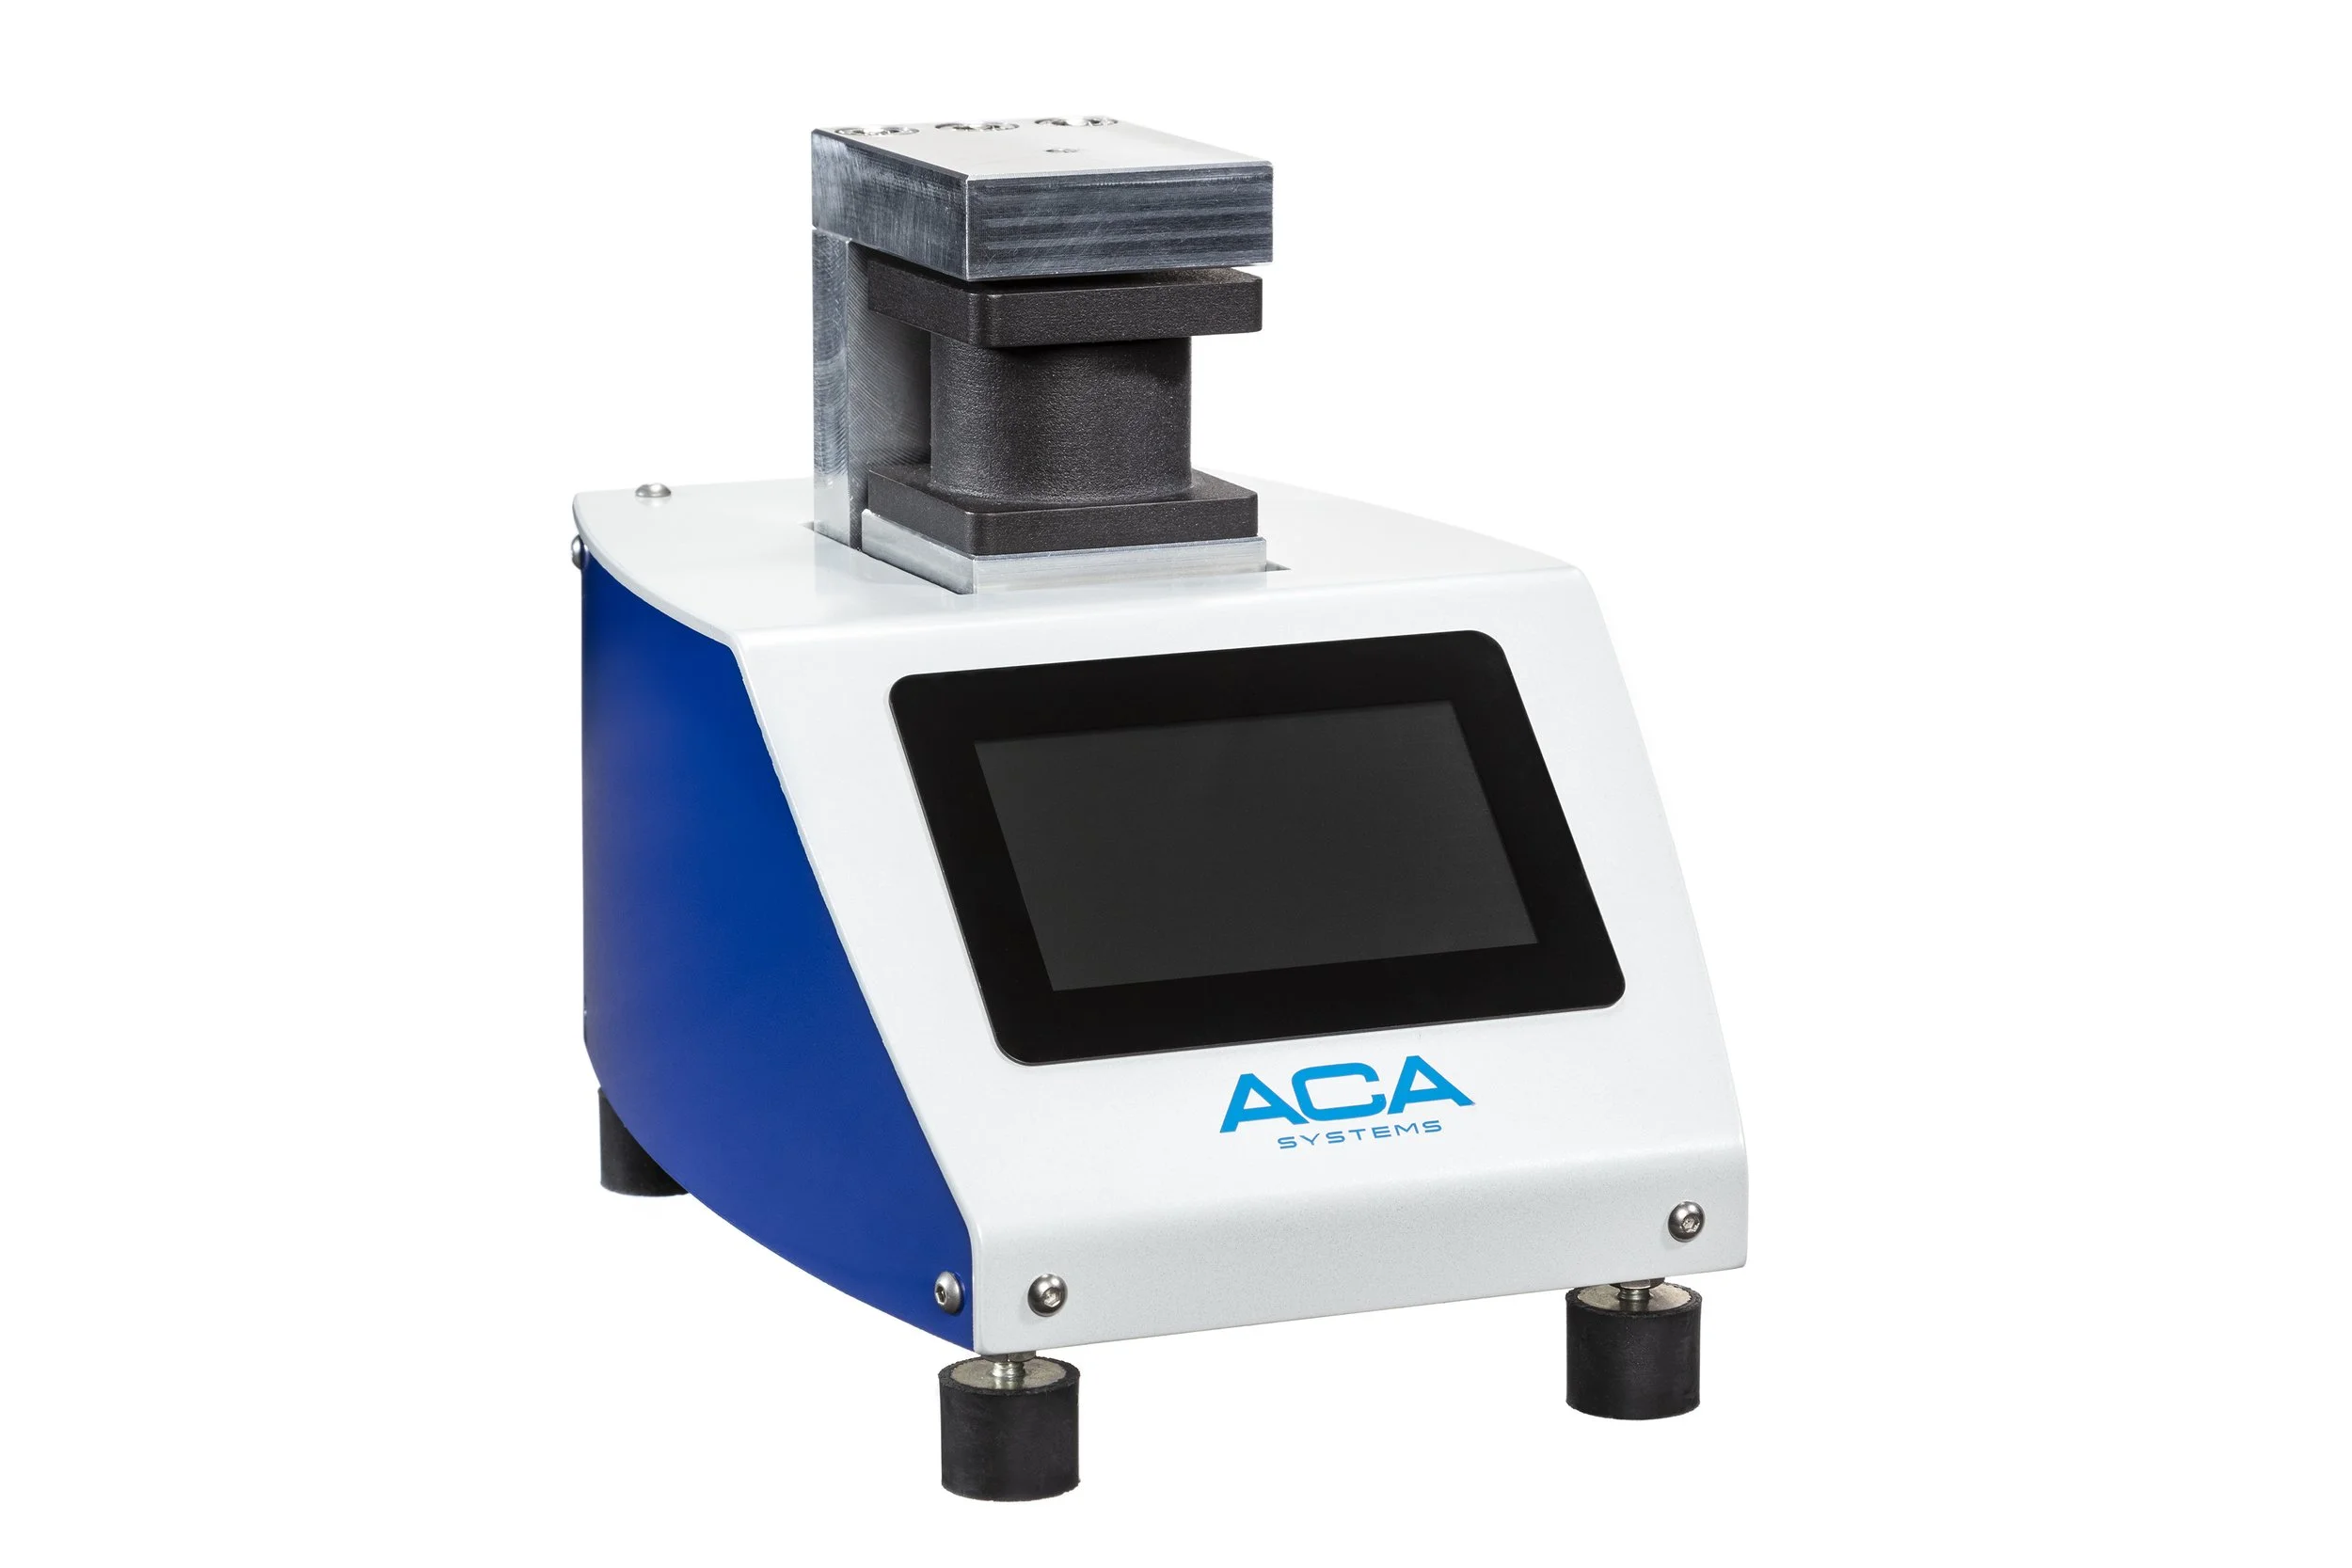
ACA Flow WR – measuring the water retention of coating colors under controlled conditions
This combined approach is particularly useful when evaluating new raw materials, comparing pigment systems, increasing coating solids or investigating difficult runnability problems.
Where can the economic value come from?
Reduced quality fluctuation
A rheological fingerprint can help detect changes in raw materials or coating preparation that are not obvious from conventional QC values, supporting more consistent production.
Faster troubleshooting and improved runnability
A disturbed production sample can be compared with the established good-running fingerprint. If rheology has changed, the investigation can focus on formulation, raw materials or preparation. If it has not changed, the team can focus on other process variables.
Recipe optimization
Once the acceptable operating window is understood, formulation changes can be evaluated against actual process requirements rather than only historical recipe targets.
Higher coating solids
Where the process allows it, rheology management can support controlled solids optimization. At constant dry coat weight, higher solids mean less water to evaporate and therefore lower drying demand.
Energy and CO₂ reduction
Reducing the amount of water that must be evaporated can lower drying-energy consumption. The associated CO₂ benefit depends on the mill's energy source and should be calculated using mill-specific data.
A practical path into mill quality control
During the learning phase, the complete rheology curve provides the most information. Once sufficient production data have been collected, the mill can select one or more reference shear rates and additional rheological key values for routine QC.
These values can be given target, warning and action limits. RheoLog can then help turn a complex flow curve into a simple quality-control view, while the full curve remains available for deeper analysis whenever a deviation occurs.
Full curve for understanding → Key values for QC → Trending → Early deviation detection → Optimization
What does your coating's rheological operating window look like?
Every coating process is different. Pigment system, formulation, application technology, machine speed and base-sheet properties all influence the relevant operating window. For this reason, the best starting point is often a discussion around the mill's real coating challenges and current QC practices rather than simply defining a generic viscosity target.
ACA can support mills in building a Rheology Management program that connects high-shear rheology, water retention, raw-material variation and actual machine performance.
Characterize production → define the good-running fingerprint → implement routine QC → identify optimization opportunities.
Interested in defining the rheological operating window for your coating process?
We can arrange an online Rheology Management session or an on-site mill workshop to review your current measurements, process challenges and potential QC approach.